Update (February 2026): G2 has acquired Capterra, GetApp, and Software Advice, making it the dominant force in B2B software discovery. Understanding G2's ranking system is now more critical than ever.
Scoring change (2026): G2's Best Software Awards now require a minimum of 10 reviews from the prior calendar year, up from just 1 review in 2025. This raises the bar for awards eligibility.
Many software websites now prominently display G2 badges like "Leader" or "High Performer" – a credibility metric that shows potential customers that the solution can be trusted. But how exactly does a company earn these awards? Understanding G2's algorithm is crucial for any strategic directory presence in B2B software.
What is G2 and Why Does It Matter?
G2 is a B2B software directory and peer-to-peer review platform where real users share experiences with business software and services. The platform has published over a million user reviews across thousands of software categories. According to recent data, 49% of software buyers use peer reviews as a primary research source, often spending significant time on review sites before engaging with vendors.
G2 generates quarterly reports, visual grids showing competitive landscapes, and awards badges that companies use extensively in marketing materials. At Blastra, we see that a strong, consistent presence across software directories significantly boosts how these badges convert during buying journeys.
G2 Scoring: The Foundation
G2's scoring system determines where software appears in search results, category rankings, and competitive grids (source: G2 Research Scoring Methodologies):
G2 Score = (Market Satisfaction + Market Presence) ÷ 2
This score determines:
- Placement on G2's Grid reports (visual quadrants showing market position)
- Ranking within software categories
- Inclusion in quarterly market reports
- Eligibility for G2 badges and awards that appear on company websites
Important Context: Scores are normalized within each category, meaning software competes against similar solutions rather than the entire G2 marketplace (source: G2 Research Guidelines).
G2 Grid Reports: The Visual Competitive Landscape
G2 Grid reports are visual representations of software categories, plotting products on two axes: Market Satisfaction (vertical) and Market Presence (horizontal). If your product is AI-native, note that G2 has created nearly 30 AI-specific categories since March 2025 — many without Grid reports yet, where first movers can earn early placement. For a worked example of how a startup used early Grid placement to win a category, see our category creation playbook based on Profound. The Grid creates four distinct quadrants:
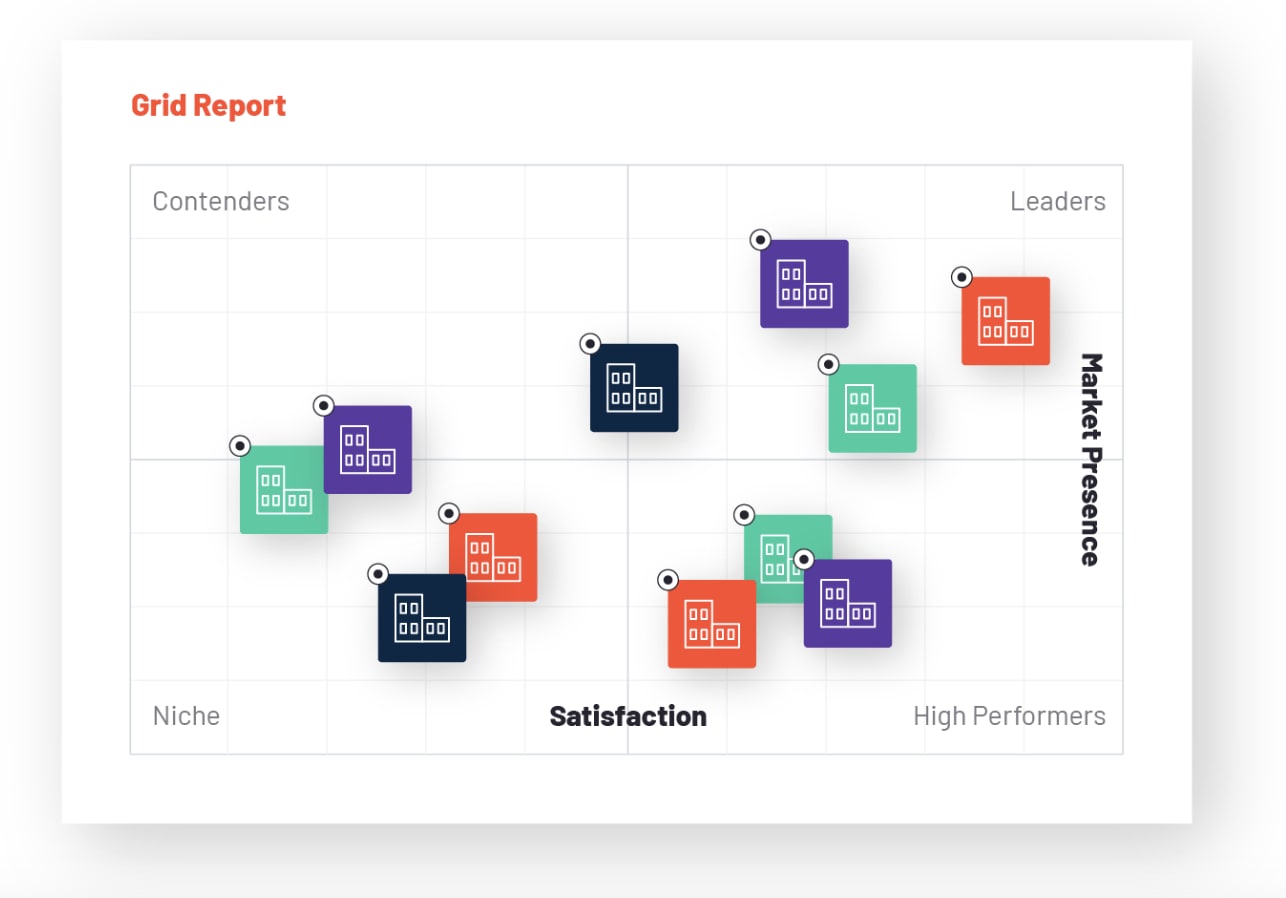
- Leaders: High satisfaction + high market presence (top-right quadrant)
- High Performers: High satisfaction + lower market presence (top-left quadrant)
- Contenders: Lower satisfaction + high market presence (bottom-right quadrant)
- Niche: Lower satisfaction + lower market presence (bottom-left quadrant)
We built a little game inspired by how software review grids work — dodge bad reviews and push toward Made It:
BADGE SWEEPER
Navigate the grid. Dodge the bad reviews.
Click any cell in Ok to start. Right-click to flag. Long-press on mobile.
These grids are published quarterly for categories that meet minimum thresholds: at least 6 products with 10+ reviews each, and 150+ total reviews.
G2 Badges: Where They Come From
Those "G2 Leader" or "G2 High Performer" badges seen on software websites come from Grid report placements and specialized Index reports. For the full breakdown of badge types, requirements, and costs, see our G2 badges guide. G2 publishes focused Index reports measuring specific aspects like:
- Usability Index: How easy the software is to use
- Implementation Index: How smoothly deployment goes
- Results Index: How well the software delivers outcomes
- Relationship Index: Quality of vendor relationships
The Two Pillars of G2 Scoring
Here's what feeds each half of your G2 Score at a glance. The detail for each factor is in the subsections below.
| Factor | Market Satisfaction (50%) | Market Presence (50%) |
|---|---|---|
| Total review count | High impact | High impact |
| Review recency (past 90 days) | High weight | High weight |
| Likelihood to recommend / NPS | ✓ | — |
| Customer support ratings | ✓ | — |
| Ease of use / setup / admin ratings | ✓ | — |
| Review detail & verified-user status | ✓ (higher weight) | — |
| Organic (non-incentivized) reviews | ✓ (bonus weighting) | — |
| Company employee count | — | ✓ |
| Company revenue | — | ✓ |
| Online presence metrics | — | ✓ |
| Third-party data (LinkedIn, Crunchbase) | — | ✓ |
What this means in practice: reviews are the only input that moves both halves of your score. The rest of Satisfaction comes from the sentiment inside those reviews; the rest of Presence comes from verifiable company data outside G2. Product-specific metrics outweigh broad company metrics on the Presence side.
Market Satisfaction: Measuring Customer Happiness
Market Satisfaction represents 50% of the G2 Score and measures actual customer contentment. G2 calculates this from multiple review-based factors:
High Impact Components:
- Total number of reviews (marked as "high importance" in G2's methodology)
- Review recency (reviews from the past 90 days carry the most weight)
- Likelihood to recommend scores (the 1-10 scale that becomes star ratings)
- Overall customer satisfaction and Net Promoter Score
- Quality of support ratings from users
- Ease of use, setup, and administration ratings
Key Detail: Review quality significantly impacts scoring. Thorough, detailed reviews from verified users receive higher weighting than brief, superficial responses.
Market Presence: Measuring Market Position
Market Presence also represents 50% of the G2 Score and assesses market position through 15 different factors combining review data with external metrics (source: G2 Research Scoring Methodologies):
High Impact Factors (in order of importance):
- Number of reviews (this factor impacts both score components)
- Recent review volume (past 90 days)
- Company employee count
- Company revenue figures
- Online presence metrics
- Third-party data sources
Critical Distinction: Product-specific metrics receive greater weight than general company metrics. Reviews specifically about the software product matter more than broad company information.
The Review Decay Factor: Time Works Against Everyone
Reviews lose influence over time through exponential decay, compounded daily (source: G2 Research Guidelines). Maintaining a steady flow of up-to-date directory content reinforces credibility even as older reviews decay.
- 0-90 days: Decay begins immediately but is gentle — reviews still carry strong weight
- First 18 months: Reviews maintain stronger weight during this period
- After 18 months: Decay rate accelerates (roughly ~30% per year)
- After ~3 years: Reviews reach approximately 3% of original weight and maintain that floor indefinitely
Real-World Impact: A software company that generated 100 reviews through a campaign 18 months ago would find those reviews beginning to lose weight faster. Consistent monthly collection matters more than large one-time campaigns.
Strategic Priorities: What Actually Moves Scores
Certain activities have disproportionate impact on scoring:
Highest Priority Actions
- Consistent Review Generation: Establishing ongoing collection processes rather than one-time campaigns (see our G2 and Capterra Reviews guide)
- Recent Review Focus: Maximizing reviews within the critical 90-day window
- Review Quality Enhancement: Encouraging detailed, thoughtful responses over brief comments
- Organic Collection: Non-incentivized reviews receive bonus weighting in the algorithm
- Category Accuracy: Ensuring reviews are properly attributed to relevant software categories
- Company Data Maintenance: Keeping third-party profiles (LinkedIn, Crunchbase) current
Secondary Priority Actions
- Customer Segment Diversification: Collecting reviews across company sizes (small business, mid-market, enterprise)
- User Experience Optimization: Addressing friction points affecting ease-of-use scores
- Review Engagement: Responding to both positive and negative feedback
- Multi-Category Strategy: Optimizing for each relevant software category
Removed or Reduced Scoring Factors
- Twitter/X Metrics: Eliminated from scoring (October 2024)
- Glassdoor Integration: Removed from Market Presence calculations (October 2024)
- Social Media Following: Reduced in importance — online presence and third-party data sources carry more weight
Common Pitfalls That Sabotage Success
Review Attribution Failures: G2 excludes reviews from users marked as "business partners," but the definition question often confuses customers. This can result in "silent failures" where reviews are collected but don't impact scoring.
Category Misattribution: Reviews get assigned to categories based on customer responses during submission. Software serving multiple categories must guide customers through these questions to ensure proper attribution. For an example of how an enterprise SaaS company manages its G2 presence around a category mismatch, see our teardown of Miro's review site strategy — the messaging is repositioning toward AI, but the categories that drive discovery still classify Miro as a whiteboard tool.
Campaign Dependency: Many companies run single review campaigns and experience score drops over time due to decay. Sustainable success requires consistent, ongoing collection.
Incentive Over-Reliance: While incentivized reviews help with volume, organic reviews carry algorithmic advantages. The most effective strategies balance both approaches.
Free vs. Paid G2 Accounts: Scoring Reality
G2's scoring algorithm treats free and paid accounts identically. The methodology documentation is available to all vendors regardless of account type, and no scoring advantages come with paid subscriptions.
Paid Account Benefits:
- Detailed analytics and competitor benchmarking
- Advanced review management capabilities
- Licensed report access for marketing use
- Preview access to draft reports
- Enhanced profile customization options
Paid Account Limitations:
- No scoring algorithm advantages
- No review weighting benefits
- No ranking preference in results
Companies can start with free accounts while focusing on fundamental scoring factors, upgrading later when advanced tools become necessary rather than for competitive advantages.
Implementation Framework: A 90-Day Approach
Weeks 1-2: Assessment
- Audit current G2 presence and scoring
- Map primary categories and competitive landscape
- Establish baseline metrics and tracking
- If you're centralizing multiple directory listings, choosing the right operational plan is essential — our pricing outlines the workflows most teams rely on
Weeks 3-6: Foundation Building
- Launch systematic customer review outreach
- Update external data sources (LinkedIn, Crunchbase)
- Begin review response strategy
Weeks 7-12: Optimization
- Implement sustainable review collection processes
- Segment outreach by customer characteristics and categories
- Monitor scoring changes and adjust tactics
Ongoing Operations:
- Monthly review collection activities
- Quarterly competitive analysis and scoring review
- Annual strategy assessment and category optimization
Key Success Patterns
Software companies that achieve top G2 positions maintain consistent review collection rather than sporadic campaigns, focus on genuine customer satisfaction over algorithm manipulation, and treat G2 success as ongoing rather than one-time effort.
Companies in "Leader" quadrants report using their G2 status throughout sales processes, while those in "High Performer" positions use their customer satisfaction strength. Even "Niche" positioning can be valuable when properly contextualized for specific market segments.
Sources
This analysis is based on publicly available G2 documentation:
- G2 Research Scoring Methodologies - Official methodology for calculating G2 scores
- G2 Research Guidelines - Standards and definitions for G2's research process
- G2 Content and Data Usage Guidelines - Guidelines for using G2 badges and content
- G2 Terms of Use - Legal terms governing G2 platform usage
Last updated: Based on G2 documentation as of March 2026
FAQ: Answers to Common Questions
What factors influence a product's ranking on the G2 Grid?
Two scoring dimensions drive Grid position, each worth 50% of the G2 Score. Market Satisfaction is review-based: total review count, recency (reviews under 90 days carry the most weight), likelihood-to-recommend scores, NPS, support quality ratings, and ease-of-use ratings. Market Presence combines review volume, recent review velocity, company employee count, company revenue, online presence, and third-party data. Product-specific signals (reviews about the software) outweigh general company metrics.
How does the G2 Grid work, and what affects a product's ranking?
The Grid is a two-axis chart — Market Satisfaction (vertical) × Market Presence (horizontal) — that plots products within a category into four quadrants: Leaders (high on both), High Performers (high satisfaction, lower presence), Contenders (high presence, lower satisfaction), and Niche (lower on both). Your quadrant position is relative to other products in your category, not to the entire G2 marketplace. Scores are normalized per category. The Grid is published quarterly and requires a category to have at least 6 products with 10+ reviews each, and 150+ total category reviews.
What determines placement in the Leader quadrant vs. High Performer?
Both quadrants require high Market Satisfaction — the difference is Market Presence. Leaders have high satisfaction and high presence (strong review velocity, larger company signals, broader online footprint). High Performers have high satisfaction but lower presence — often newer or more focused products with strong customer love but not yet the volume or company-scale signals of category Leaders.
How does G2 create new categories?
G2 creates and updates categories in response to market signals — user search behavior, vendor taxonomy requests, analyst coverage, and emerging product patterns. Since March 2025, G2 has added nearly 30 AI-specific categories; many of those don't yet have Grid reports, which creates an opening for early movers to establish position before the category fills in. For the mechanics of how AI categories specifically are formed and what they mean for vendors, see our G2 AI categories guide.
How many reviews do I need to appear on G2 Grid reports?
10+ recent reviews minimum for meaningful visibility. Grid reports require categories with 6+ products having 10+ reviews each and 150+ total reviews. More reviews increase your Market Presence score.
Do paid G2 accounts get better rankings?
No. G2's algorithm treats free and paid accounts identically. Paid accounts offer analytics and enhanced profiles — no scoring advantages. Focus on reviews first.
How quickly do reviews lose their impact?
Reviews under 90 days old carry full weight. From 90 days to 12 months: moderate decay. After 12 months: ~30% annual decay. After 24 months: minimal weight. Consistent collection beats one-time campaigns.
What's more important: review quantity or quality?
Quality has outsized impact. Detailed reviews from verified users receive higher weighting. Organic (non-incentivized) reviews get algorithmic bonuses. Prioritize substantive reviews over volume.
Can I incentivize customers to leave reviews?
Yes, through official programs — G2 paid campaigns, Capterra gift cards up to $25. Incentives must be for reviewing, not positive sentiment. Organic reviews receive algorithmic advantages, so balance both approaches.
Disclaimer: This article provides educational analysis of publicly available G2 methodology documentation. This content is not sponsored, endorsed, or affiliated with G2.com, Inc. G2®, G2 Grid®, and related trademarks are the property of G2.com, Inc.
Related Guides
- How G2 Badges Work — G2 badges require paid plans to display; here's what you need to know
- How to Get G2 and Capterra Reviews — Review requirements and best practices for both platforms
- How Capterra Badges Work — Complete guide to earning Capterra badges with 2026 deadlines
- How SourceForge Badges Work — Percentile-based awards: top 5% for Leader, top 10% for Top Performer
- How G2 Is Building G2.ai Into an Expertise Marketplace — What G2 is building beyond the Grid, explored in its open beta
Want to get listed on top software directories?
Blastra automates the submission process and listings management for B2B software companies